The problem
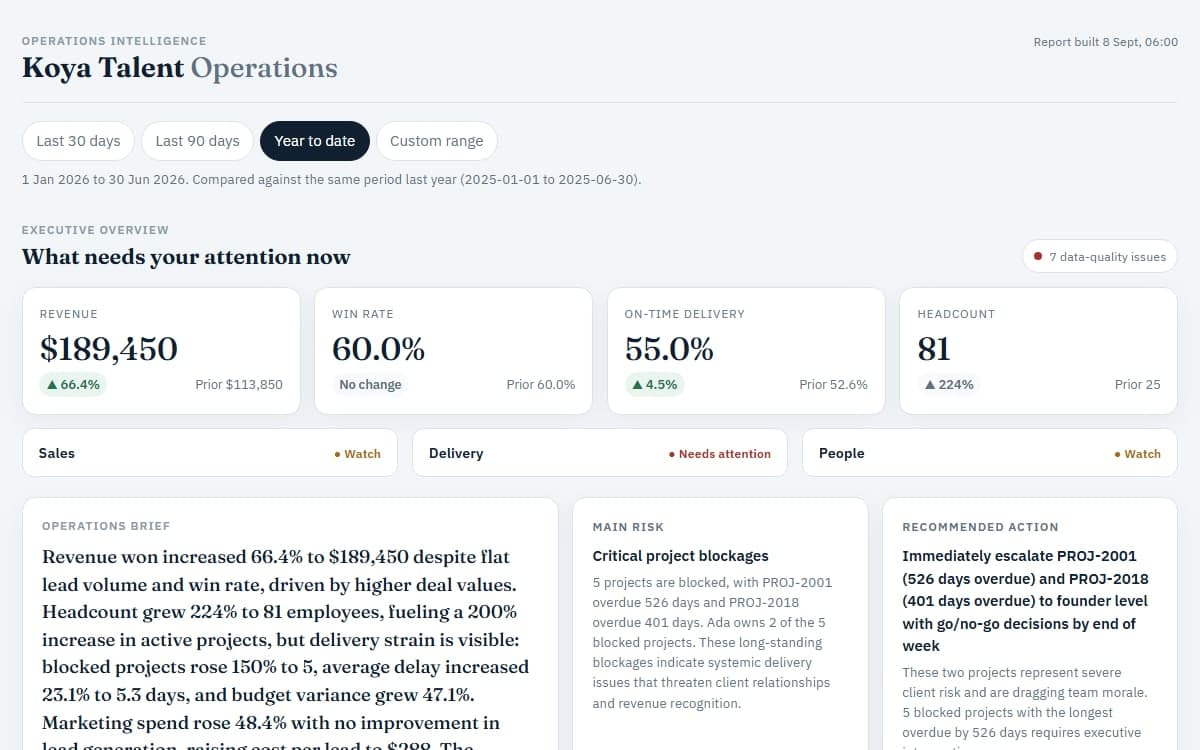
Sales lived in a spreadsheet, delivery in Airtable and people data behind an API. The founder needed one honest picture of all three, every morning.
The last 30 days, the last 90 days, the year so far, or any range they pick. Each compared with the right period before it, and explained in plain words.
- The AI explains, never calculates
- Unknown is never zero
What I asked first
The brief left these open. I answered each one in the workflow itself, where it can't drift.
- What date is "today" for this data? The data ends on 30 June 2026. Every period counts back from there, so the numbers follow the data, not the calendar.
- What should year to date compare against? The same months last year. Against the last six months, a seasonal dip looks like a performance problem.
- What counts as an active project? Any project running during the period, not only those that started in it. Otherwise a recent period shows zero active projects, and zero looks real.
- Who counts in headcount? Worked out from start and exit dates, never the status field. Some records marked "Active" hadn't started yet.
- What if a source fails? Its numbers show as unknown, with the reason. A failed source reported as zero would read as fact.
- What does the model get to see? The worked-out numbers and what they're compared against, never the raw rows. Raw rows invite it to do arithmetic.
How it runs
- Start
- Tool
- Stored
- Code
- Check
- AI
- Result
- Error
01, Trigger:
Every morning, or on request
Schedule, webhook
6am daily, or any range from the dashboard.
- Schedule Trigger
- Webhook: Custom Range
- Run Config
- Close Abandoned Runs
02, Step:
Pull three sources
Sheets, Airtable, API
Every date checked. Every problem logged.
- Fetch Sales
- Fetch Delivery
- Fetch People Ops
- Clean Sources
03, Data:
Store the clean records
Supabase
One source of truth.
- Upsert Sales Records
- Upsert Delivery Records
- Upsert People Records
04, Code:
Work out 27 metrics
Code
Each against the right period before it.
- Compute Metrics
05, Logic:
One period at a time
Loop
Nothing moved? Reuse the last analysis.
- Create Run
- Loop Over Periods
- Find Prior Insight
- Decide Reuse
- Reuse Insight?
06, AI:
Explain what changed
Claude Sonnet 4.5
Sees the worked-out numbers, never raw rows.
- Build Analysis Prompt
- Claude: Analyse
- Claude Sonnet
- Parse Insights
07, Data:
Save the report
Supabase
Metrics, warnings and insights, in one go.
- Build Supabase Payloads
- Insert Metrics
- Insert Warnings
- Insert Insights
- Complete Run
Then: step 5 (next period); step 8 (done).
08, Output:
Email the founder
Gmail
One email per run, even when all is well.
- All Periods Complete
- Fetch Run Digest
- Build Digest
- Send Digest
- Record Alert Sent
09, Error:
Close a failed run
Code
Never left showing 'running'.
- Mark Run Failed
- Close Failed Run
Enforced, not requested
- The AI never does the maths Every number is computed in code. Claude only explains them.
- Unknown is never zero A number that can't be computed says why. A failed source is never reported as zero.
- Bad dates don't slip through A date like 30 February is rejected, not quietly moved into March.
- Nothing is dropped silently Every problem in the source data is logged, with what it affected.
- Small samples are flagged A rate built on fewer than five records is marked low confidence.
- No paying twice for one answer If the numbers haven't moved, the last analysis is reused.
- No run left hanging A run that fails is closed and marked failed, never left "running".
- Good news looks like good news Each metric knows which way is better, so rising costs never look like rising revenue.
The thing that nearly got past me
Incident
Marketing spend, counted once per row
Marketing spend in the sales sheet is a monthly figure, repeated on every row of that month. Adding the column up, the obvious move, overstated spend by roughly the number of rows in each month. Cost per lead would have been off by the same factor, on a report a founder reads to decide where money goes.
The fixOne figure per month, pro-rated when a period covers only part of it.
In numbers
27
metrics per period, all computed in code
3
sources in one report: sales, delivery and people
1
email to the founder at 6am, even when nothing's wrong
4
views: 30 days, 90 days, year to date, or any range
0
AI calls when the numbers haven't moved. The last analysis is reused.
5
records at least before a rate is trusted. Fewer is flagged.
From the workflow itself.
What it refuses to do
- Do maths with the AI Claude only sees numbers worked out in code.
- Report a failed source as zero Its numbers show as unknown, with the reason.
- Send raw rows to the model It gets the worked-out picture, not the data.
- Stay quiet when nothing's wrong A clean run still sends a short email. Silence looks like a workflow that stopped.
What I took from it
A number I can't compute is unknown, with a reason. Never zero. A zero reads as a fact.
The limit I'd fix first
if I did it again
- AI cost is sometimes a guess. When n8n doesn't pass on the model's usage, the cost is estimated from the length of the text. It's labelled as an estimate, but I'd rather measure it.
Check it yourself
- Live dashboard (opens in a new tab)
- Walkthrough video (opens in a new tab)
- Workflow fileStructure only. Credentials and settings removed.